Buoyant Economies
USA
Bank credit, current account deficit, inflation, wages
and employment
The USA appears to have to experience the same relationship between bank credit and the current account deficit as found in Australia, the Philippines and New Zealand. Figure 1 shows the growth of commercial bank credit, the current account deficit and the fiscal deficit. It is clearly evident that there is no correlation between the fiscal deficit and the current account deficit. When the US government budget was in surplus (shown below as the period when the accumulated fiscal deficit was declining), there was no reduction in the rate of growth of the current account deficit. So far in this century, the USA current account deficit has averaged $1.6 billion per day. Initially, after the global financial crisis (GFC), there was no growth in bank credit. However, in more recent years, there has been growth in private bank credit, although initially slower than before the GFC. Also, the US government has been borrowing from the banking system and this appears to have contributed to the current account deficit during the period when there was little growth in bank credit for the private sector.
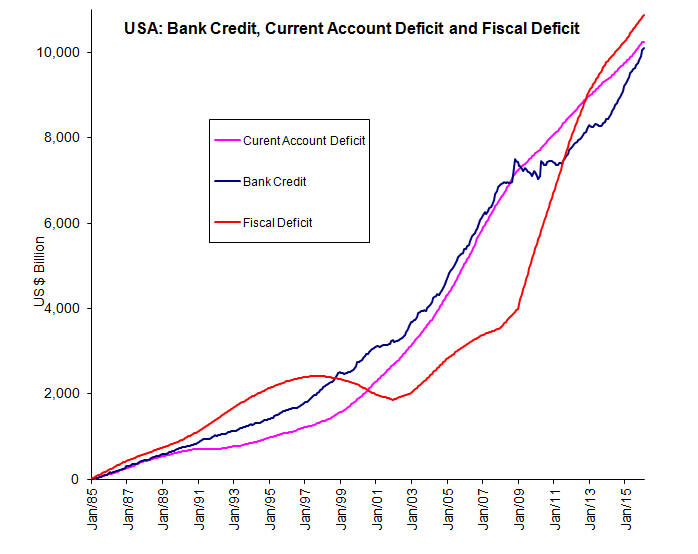
Figure 1: USA- Bank Credit, Current Account Deficit and Fiscal Deficit
A diagrammatic explanation of the relationship between the growth of bank credit and the current account deficit is provided in the Impact of the Floating Exchange Rate System on Debt page at paragraph 32. A mathematical and diagrammatical explanation is provided on the page on Formula for the Current Account Balance. The sustainability of the monetary growth and the rising foreign debt is considered in Money and Unsustainable Debt.
Further analysis is still required to more accurately identify the sources of unendowed money in the USA and explain the divergence of the current account deficit from the growth of commercial bank credit in the 1990s. It may have been due to the intervention of the Federal Reserve in the foreign exchange market (see the Plaza Accord - particularly the conclusions).
The strong relationship between the growth of commercial bank credit and the current account deficit implies that the USA is responsible for its own external balance and its rising foreign debt. This means that the US has the capacity to control the outcome of its current account to its own advantage. It does not need to rely on other countries such as China or Japan to manage their economies for the benefit of the USA.
Just as the US was able to reduce its current account deficit relative to its monetary growth between 1991 and 1999, it is possible to grow bank credit and the money supply in such as way as to eliminate the current account deficit. Note that the Philippines has reversed the relationship between monetary growth and the current account balance and has also raised the rate of economic growth.
The rise in the US current account deficit has been attributed to the rise in its fiscal deficit. Clearly, the data presented in the graph would indicate that the fiscal deficit has not been a significant factor over this time. The growth of bank credit is clearly the key factor. The wider implications of this are considered in the Impact of the Floating Exchange Rate System.
As for Australia and New Zealand, the relationship between the growth of the unendowed money supply and the growth of GDP appears to explain inflation in the USA since about 1995, as shown in Figure 2 below. Note that the data shown is not lagged. The derivation of the formula used to plot this relationship is explained on the Money and Inflation webpage.
Figure 2: USA- CPI and Modelled CPI
Figure 3 shows the CPI for the USA since 1913. It clearly shows the sudden increase in the rate of inflation following the floating of the US dollar in 1973. Note that most economists would deny that there is any causal relationship between inflation and the floating exchange rate system.
Figure 3: USA- CPI since 1913 showing the pre and post float price trends
Another important issue is the effect of the floating exchange rate system upon wages. The following graph shows how average weekly wages for private non-farm workers. Since 1973 when the exchange rate was floated, the wages of these US workers has been fallen dramatically. Before then, they had been rising. The growth in US wages since 1992 has only been at half the rate it was in the 1960's to 1973. Average weekly wages for private nonfarm workers in constant 1992 dollars are shown in Figure 4. Note that if US average real wages had continued to grow at the rate they had been before the float (i.e., 1.2% pa), they would be at least 70% higher than they are now.
Figure 4: USA- Average Weekly Earnings for production workers in constant 1992 dollars
Source: US Bureau of Labour Statistics (1964 to December 2010)
Similarly, unemployment in the USA has been higher since the exchange rate was floated as shown in Figure 5.
Figure 5: USA- Unemployment 1950 to June 2011 (12 month rolling average)
These problems are considered in the Impact of the Floating Exchange Rate System on Employment and growth. They can be rectified using exchange rate systems such as the optimum exchange rate system.
The situation in the USA between 2008 and early 2011 where the current account deficit is greater than the growth in bank credit suggests that the government deficit is being financed from bank credit, in particular from the Federal Reserves. The Federal Reserve's lending to government is not included in the statistics used to prepare Figure 1.
To read more about these and similar issues, see the issues page and papers on the subject.
The data for USA charts showing the linkages to raw data is available here.
Use the following link to the Buoyant Economies Facebook page to make a comment or ask a question.
(Started 26 August 2011)
The Growth of Debt and the Loss of Income in America
Formula for the current account balance
Return Australia Philippines New Zealand
Last update: 28 March 2016